Feature Tour
This page explains the major Astute Inspect features and the developer problems each one solves.
1. Process View + DDS Entities Trees
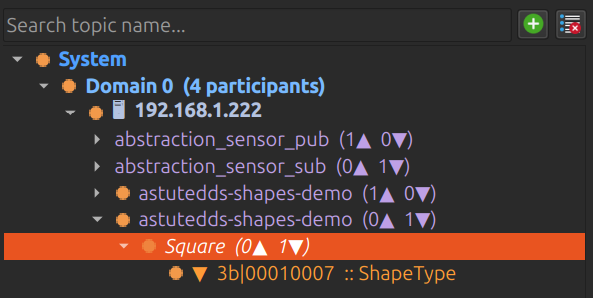
Use the two synchronized trees to move between:
- process-centric debugging (which executable is misbehaving)
- topic-centric debugging (which data path is blocked)
The counters beside each node provide immediate context for writers/readers and help you avoid opening irrelevant topics.
2. Topology Canvas
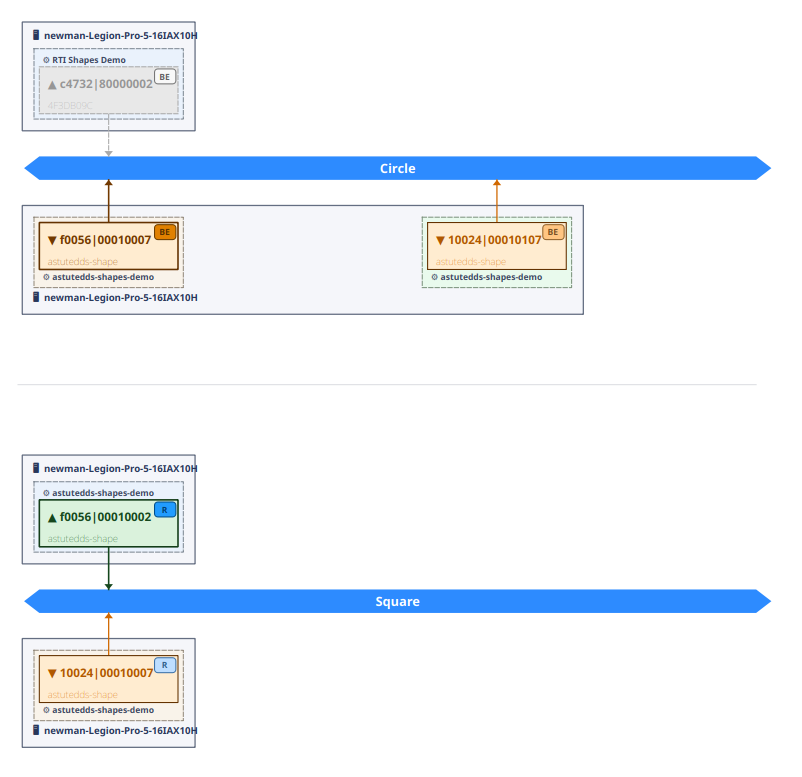
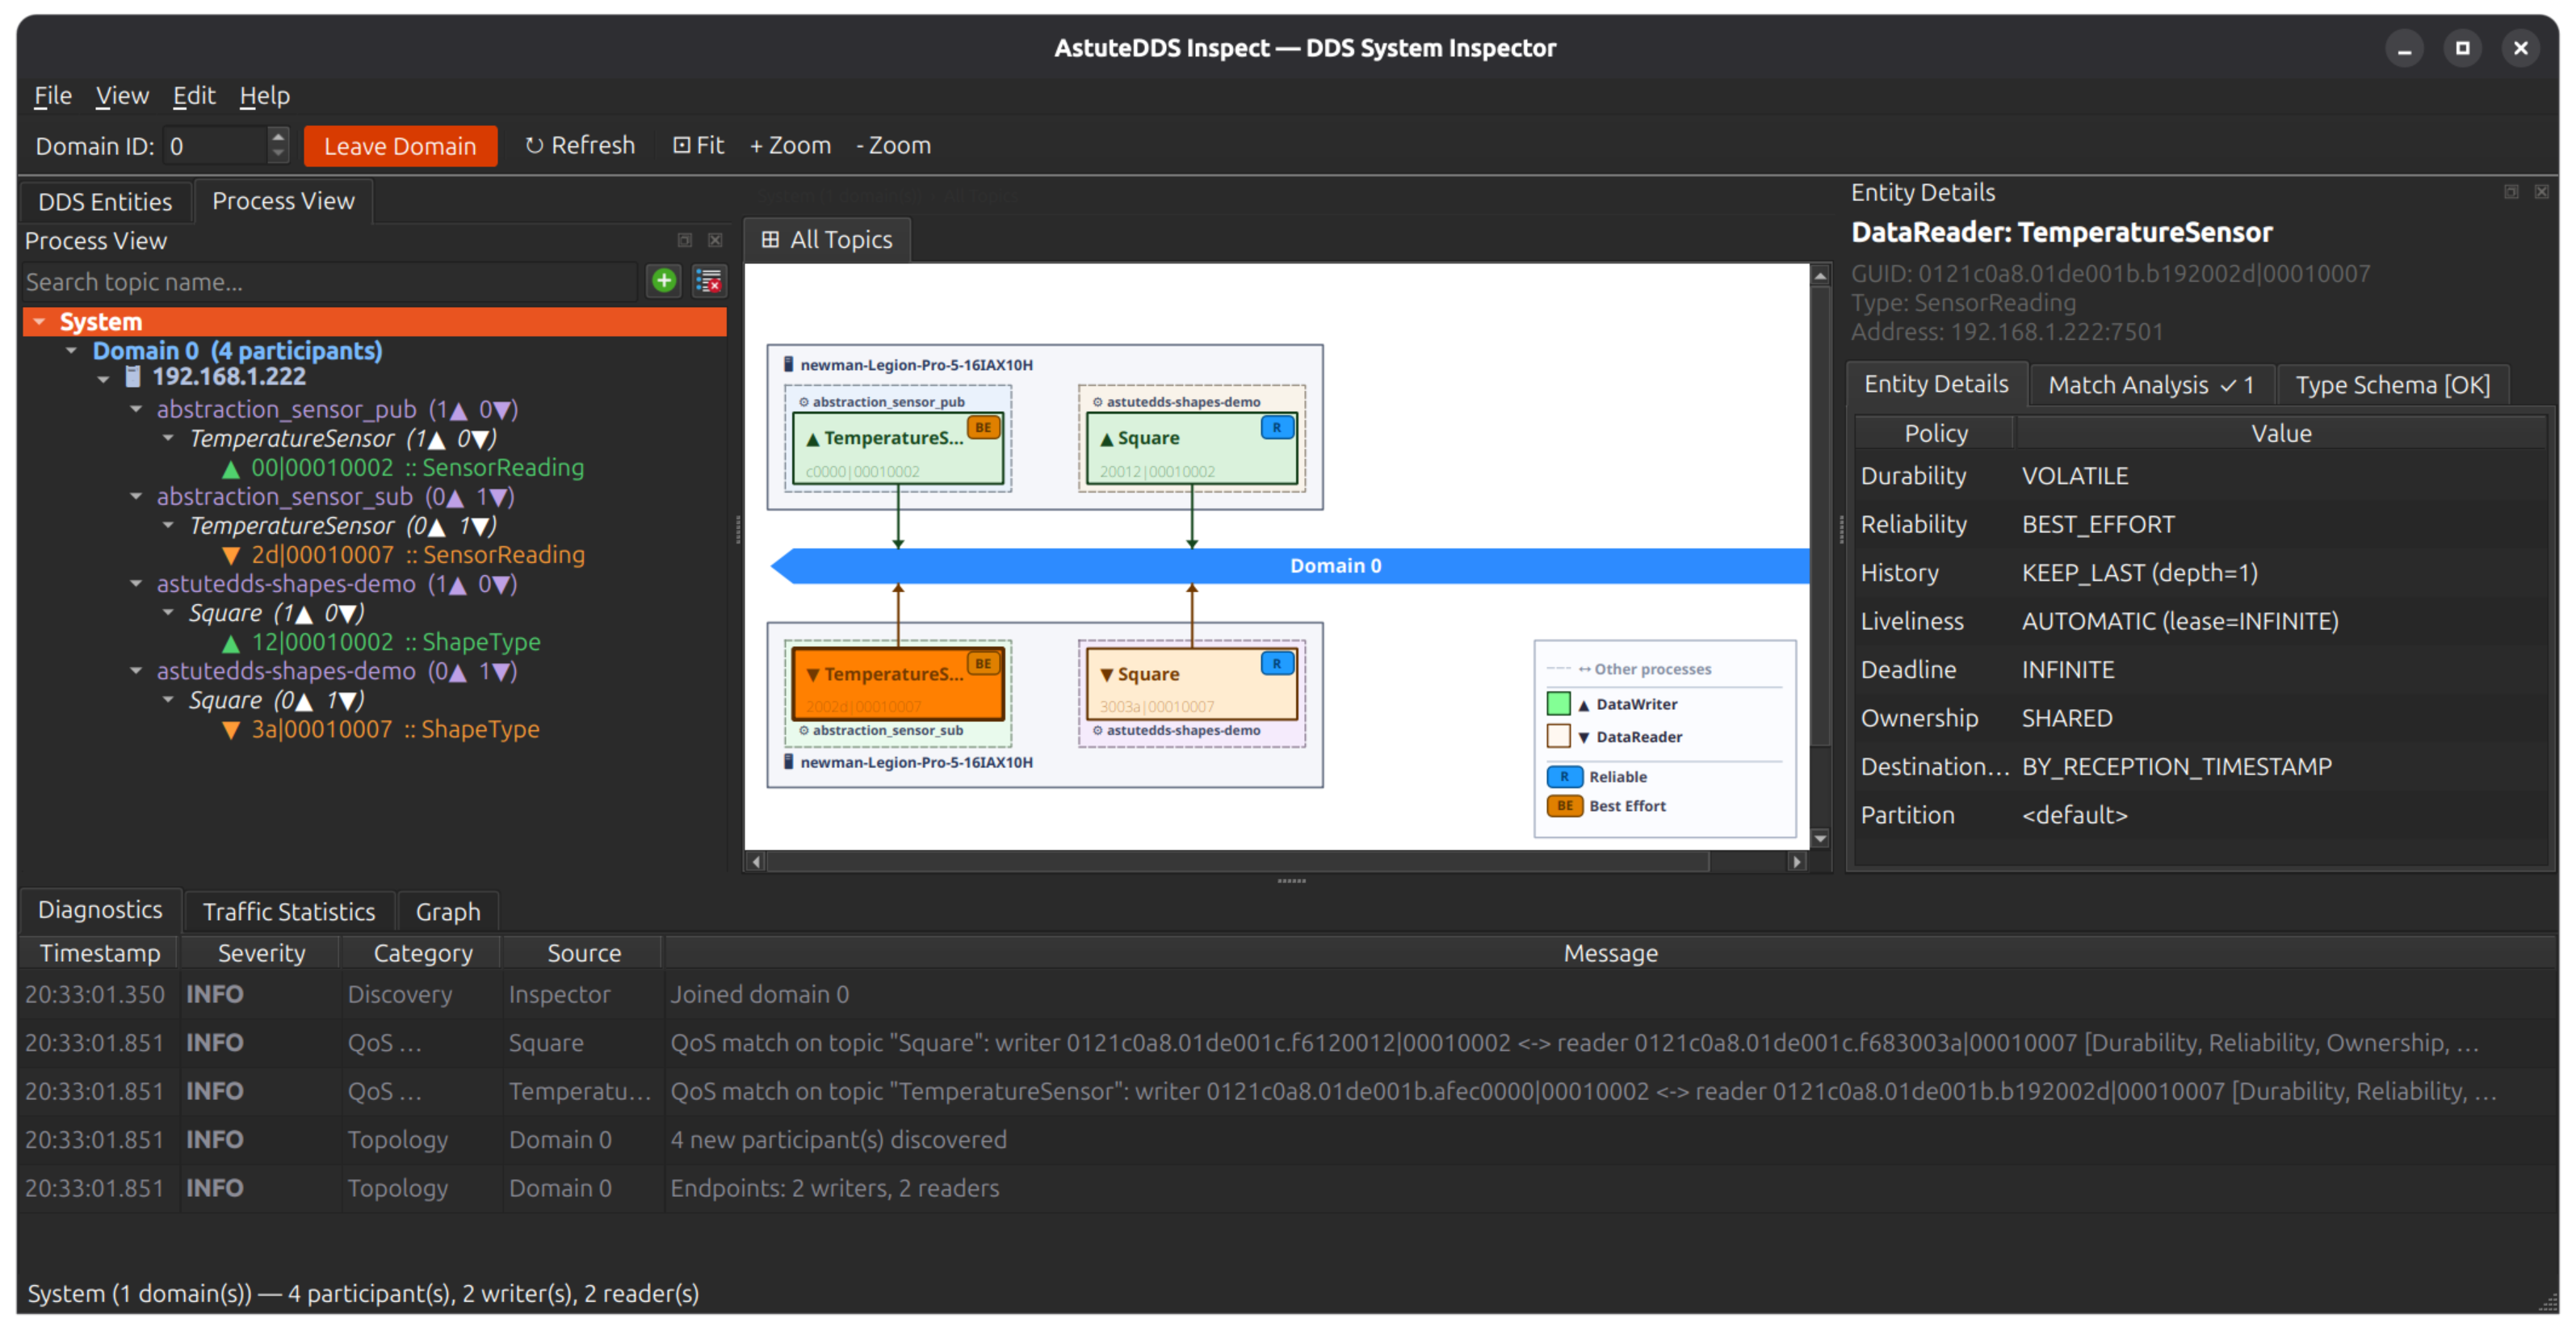
The center canvas visualizes active publisher/subscriber relationships. This is useful for validating that your intended data flow really exists in the running system.
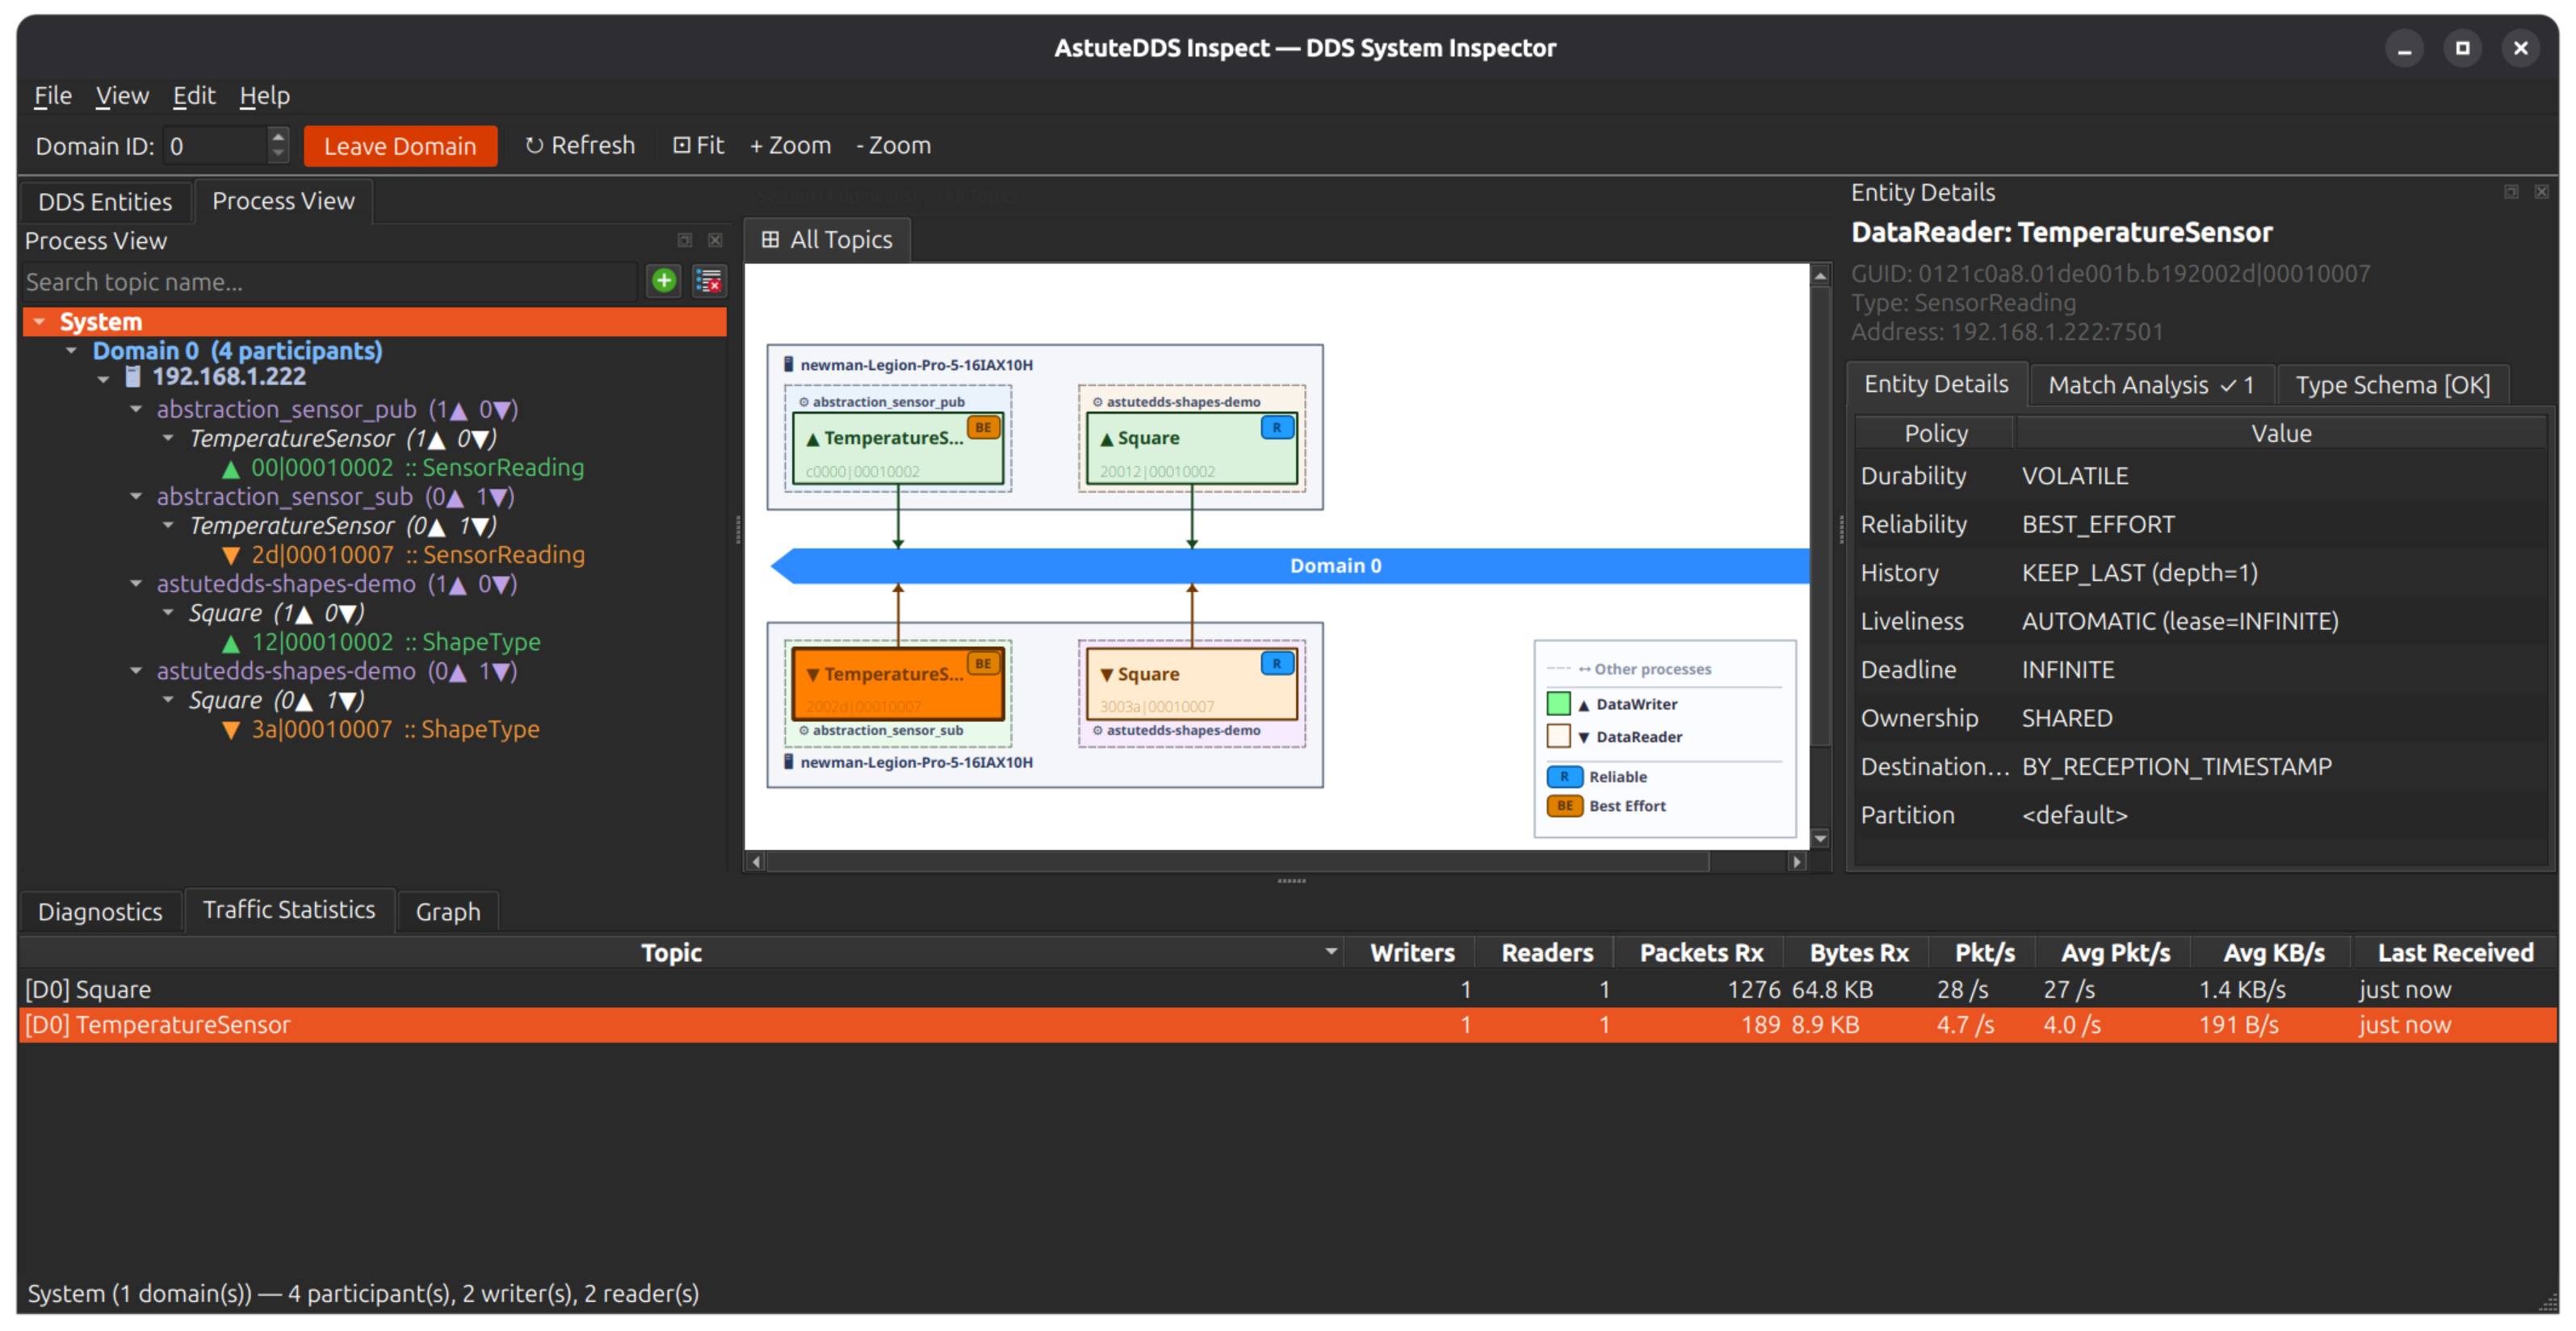
Value to developers
- Spot missing links before deep packet analysis
- Confirm endpoint direction and topology intent
- Cross-check process grouping when multiple apps share domain resources
3. Diagram Tab Navigation
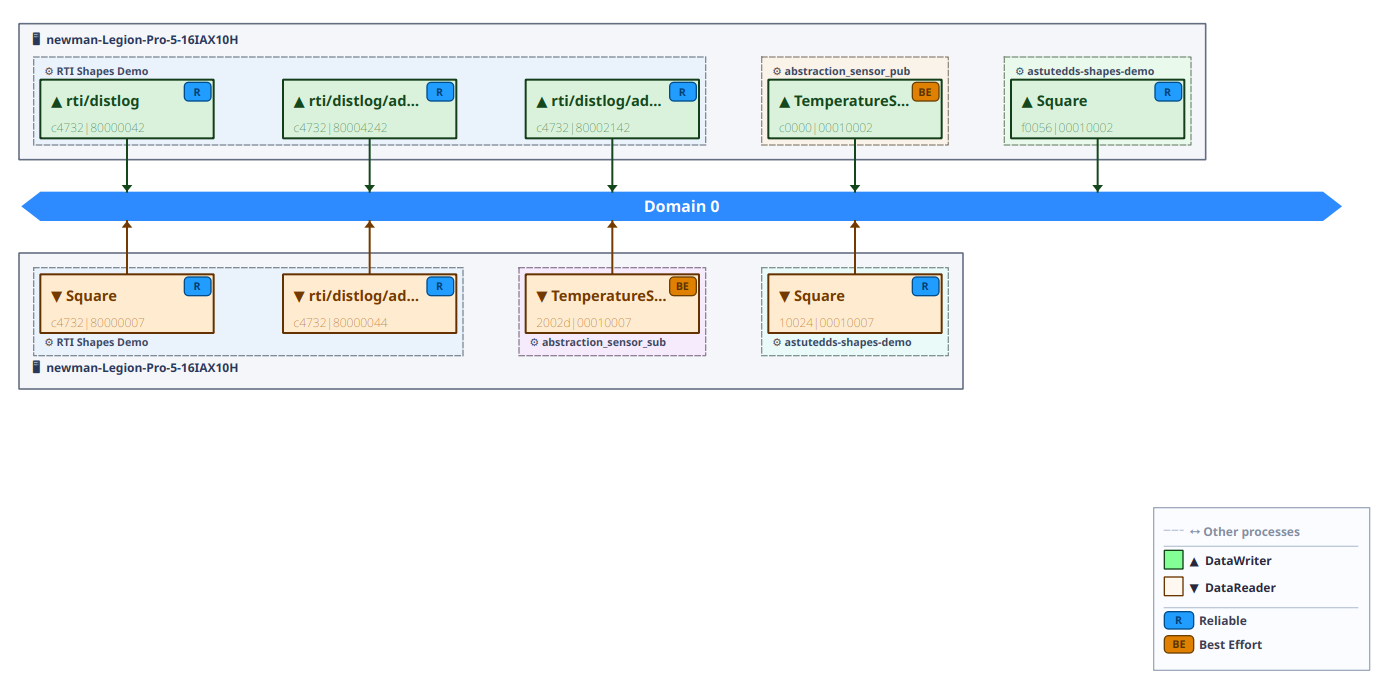
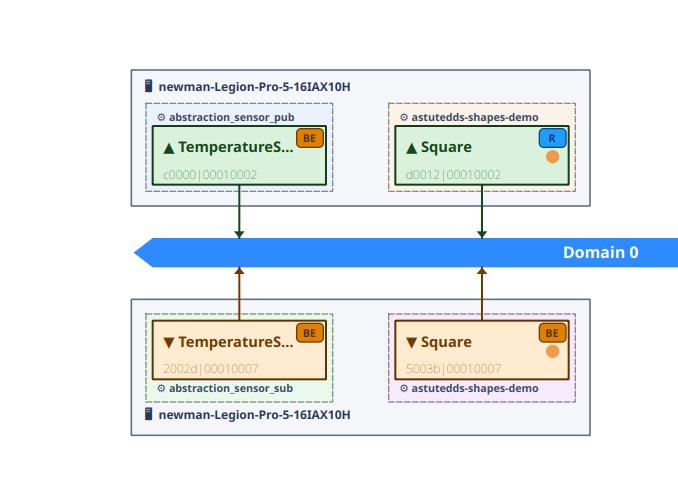
The diagram area uses a tabbed layout. The pinned All Topics tab (index 0) shows a domain-wide bus with every endpoint across all topics in a single view — useful for an instant system overview. Additional tabs open one per topic when you click into a specific topic path.
Domain mode and per-topic tabs
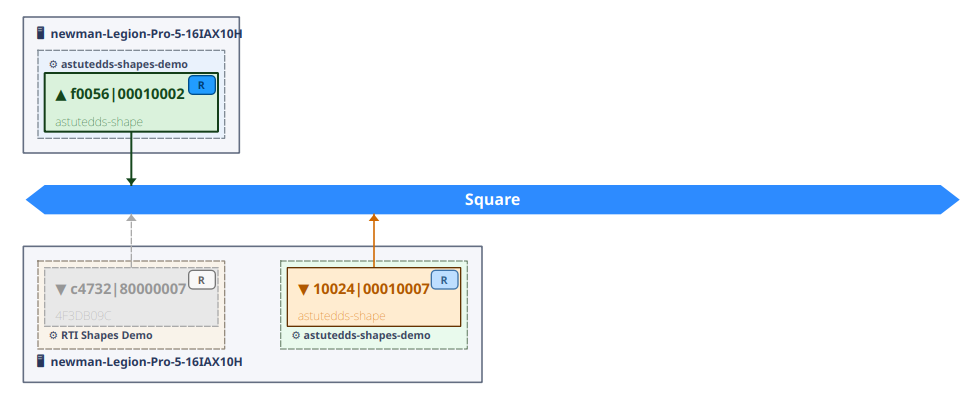
Tab management
Right-click any tab header to open a context menu that lets you close tabs to the right, to the left, others, or all (the All Topics tab is always preserved).
Zoom and scroll
- Scroll wheel zooms in and out without requiring a modifier key.
- Pan by dragging the scene.
- The zoom level and scroll position are preserved across periodic scene refreshes, so the view does not jump while data is updating.
- Press Fit (or call autoFit) to reset to 1:1 and re-centre on the scene top-left.
Endpoint tooltips
Hovering over any endpoint box shows the full topic name, which is helpful in the domain-wide view where multiple topics share the same bus.
Value to developers
- Domain mode gives a single-screen answer to "what is talking to what?" across the whole domain
- Tab context menu keeps the workspace tidy during multi-topic investigations
- Zoom persistence means you can stay focused on a region of interest during a long debug session
4. Entity Details + Match Analysis
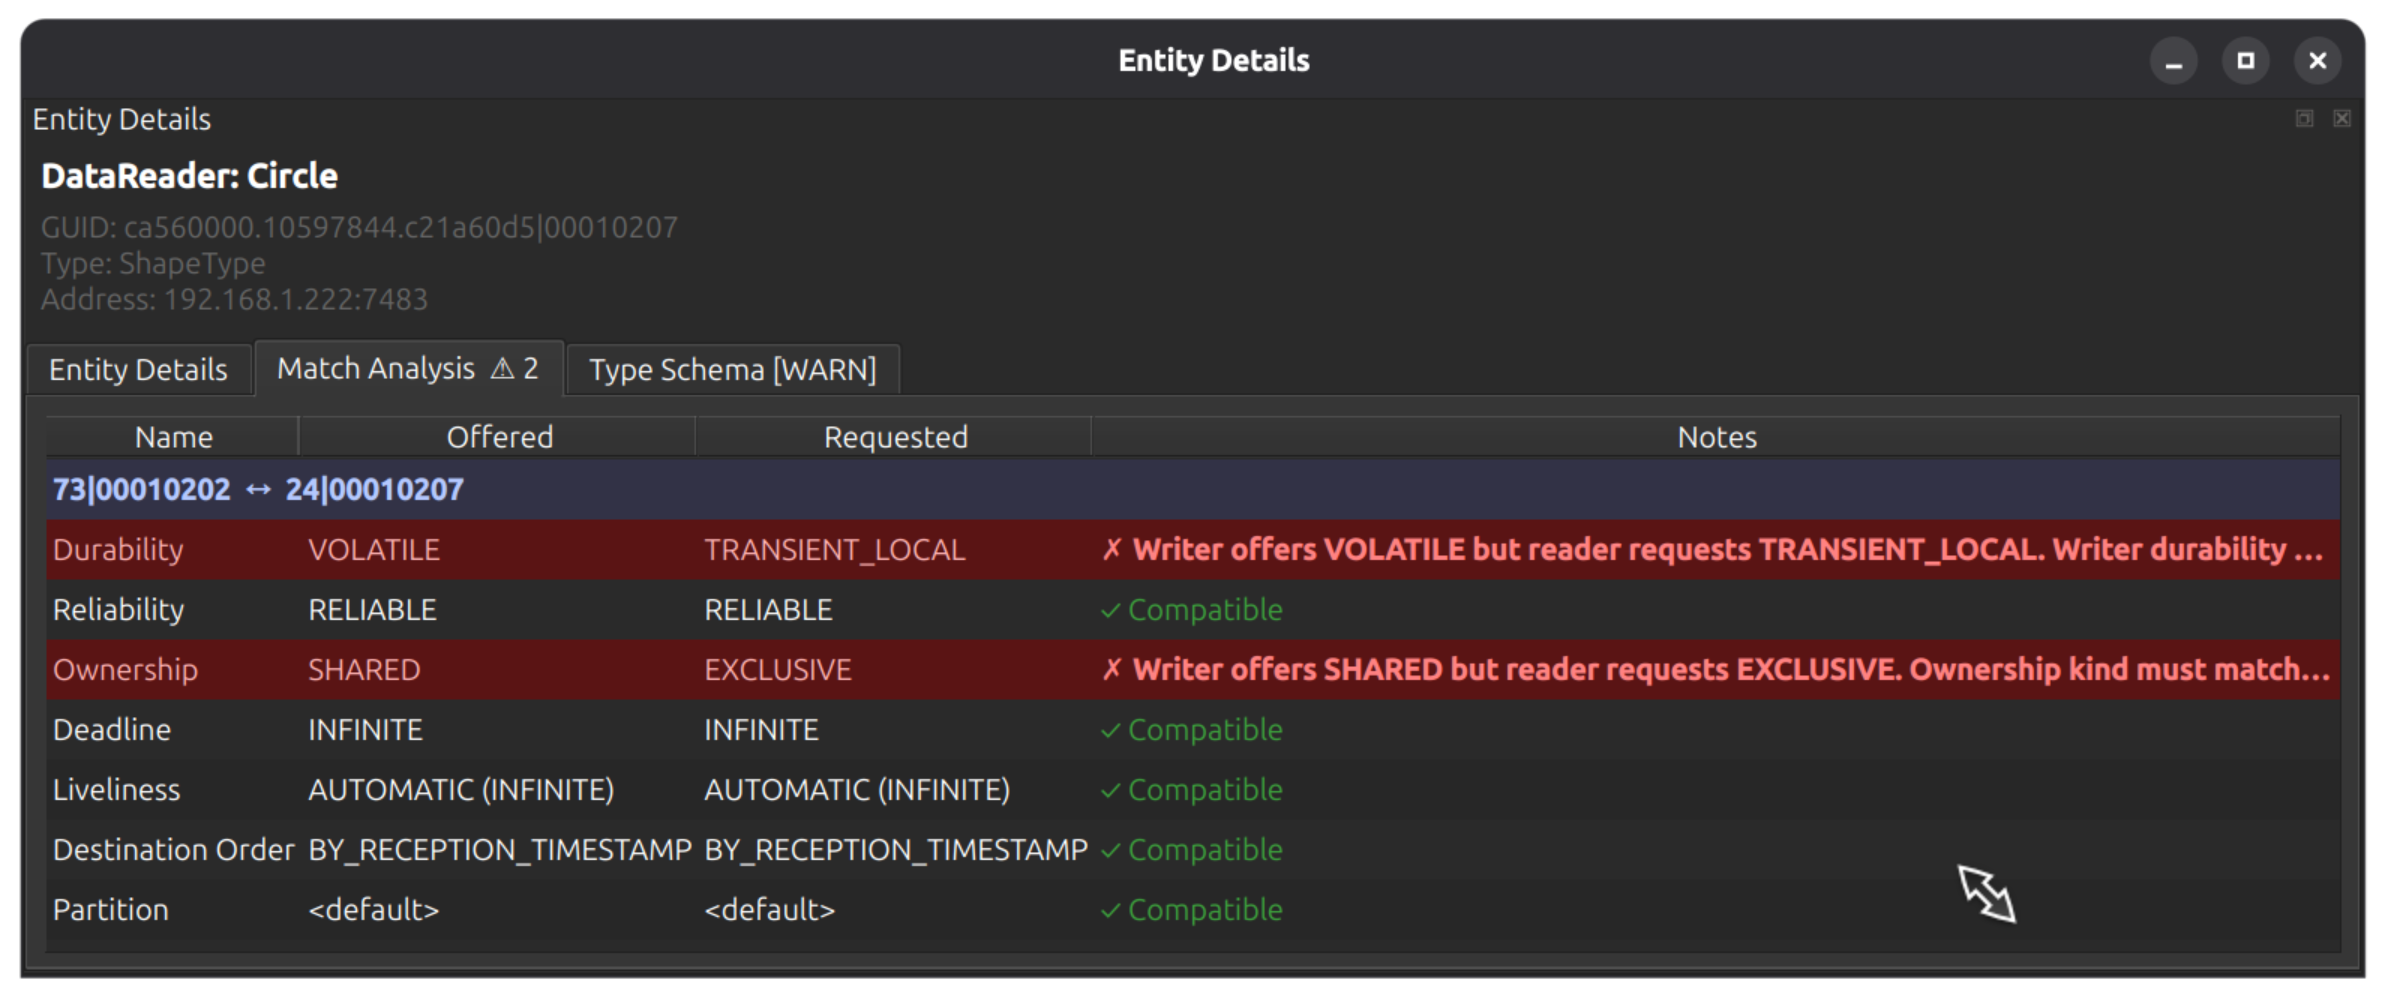
The right panel provides endpoint-specific evidence for offered vs requested QoS. This removes guesswork when a reader does not receive samples.
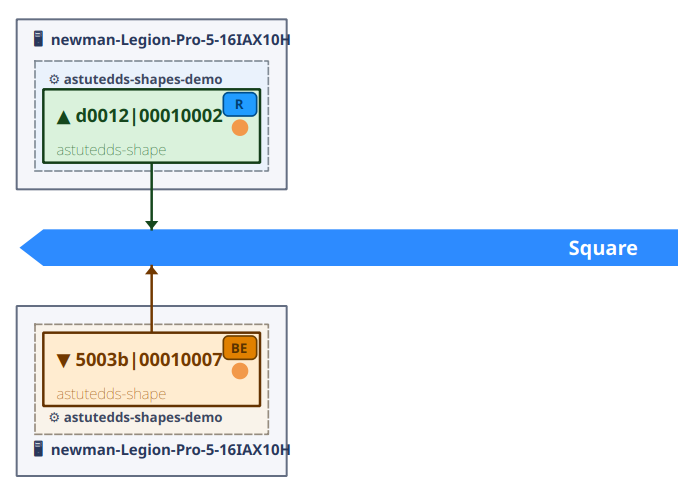
You can also zoom into a single topic path to understand where incompatibility is introduced.
Value to developers
- Diagnose match failures in seconds, not hours
- Share deterministic evidence in bug reports and code reviews
- Validate QoS profile changes before release
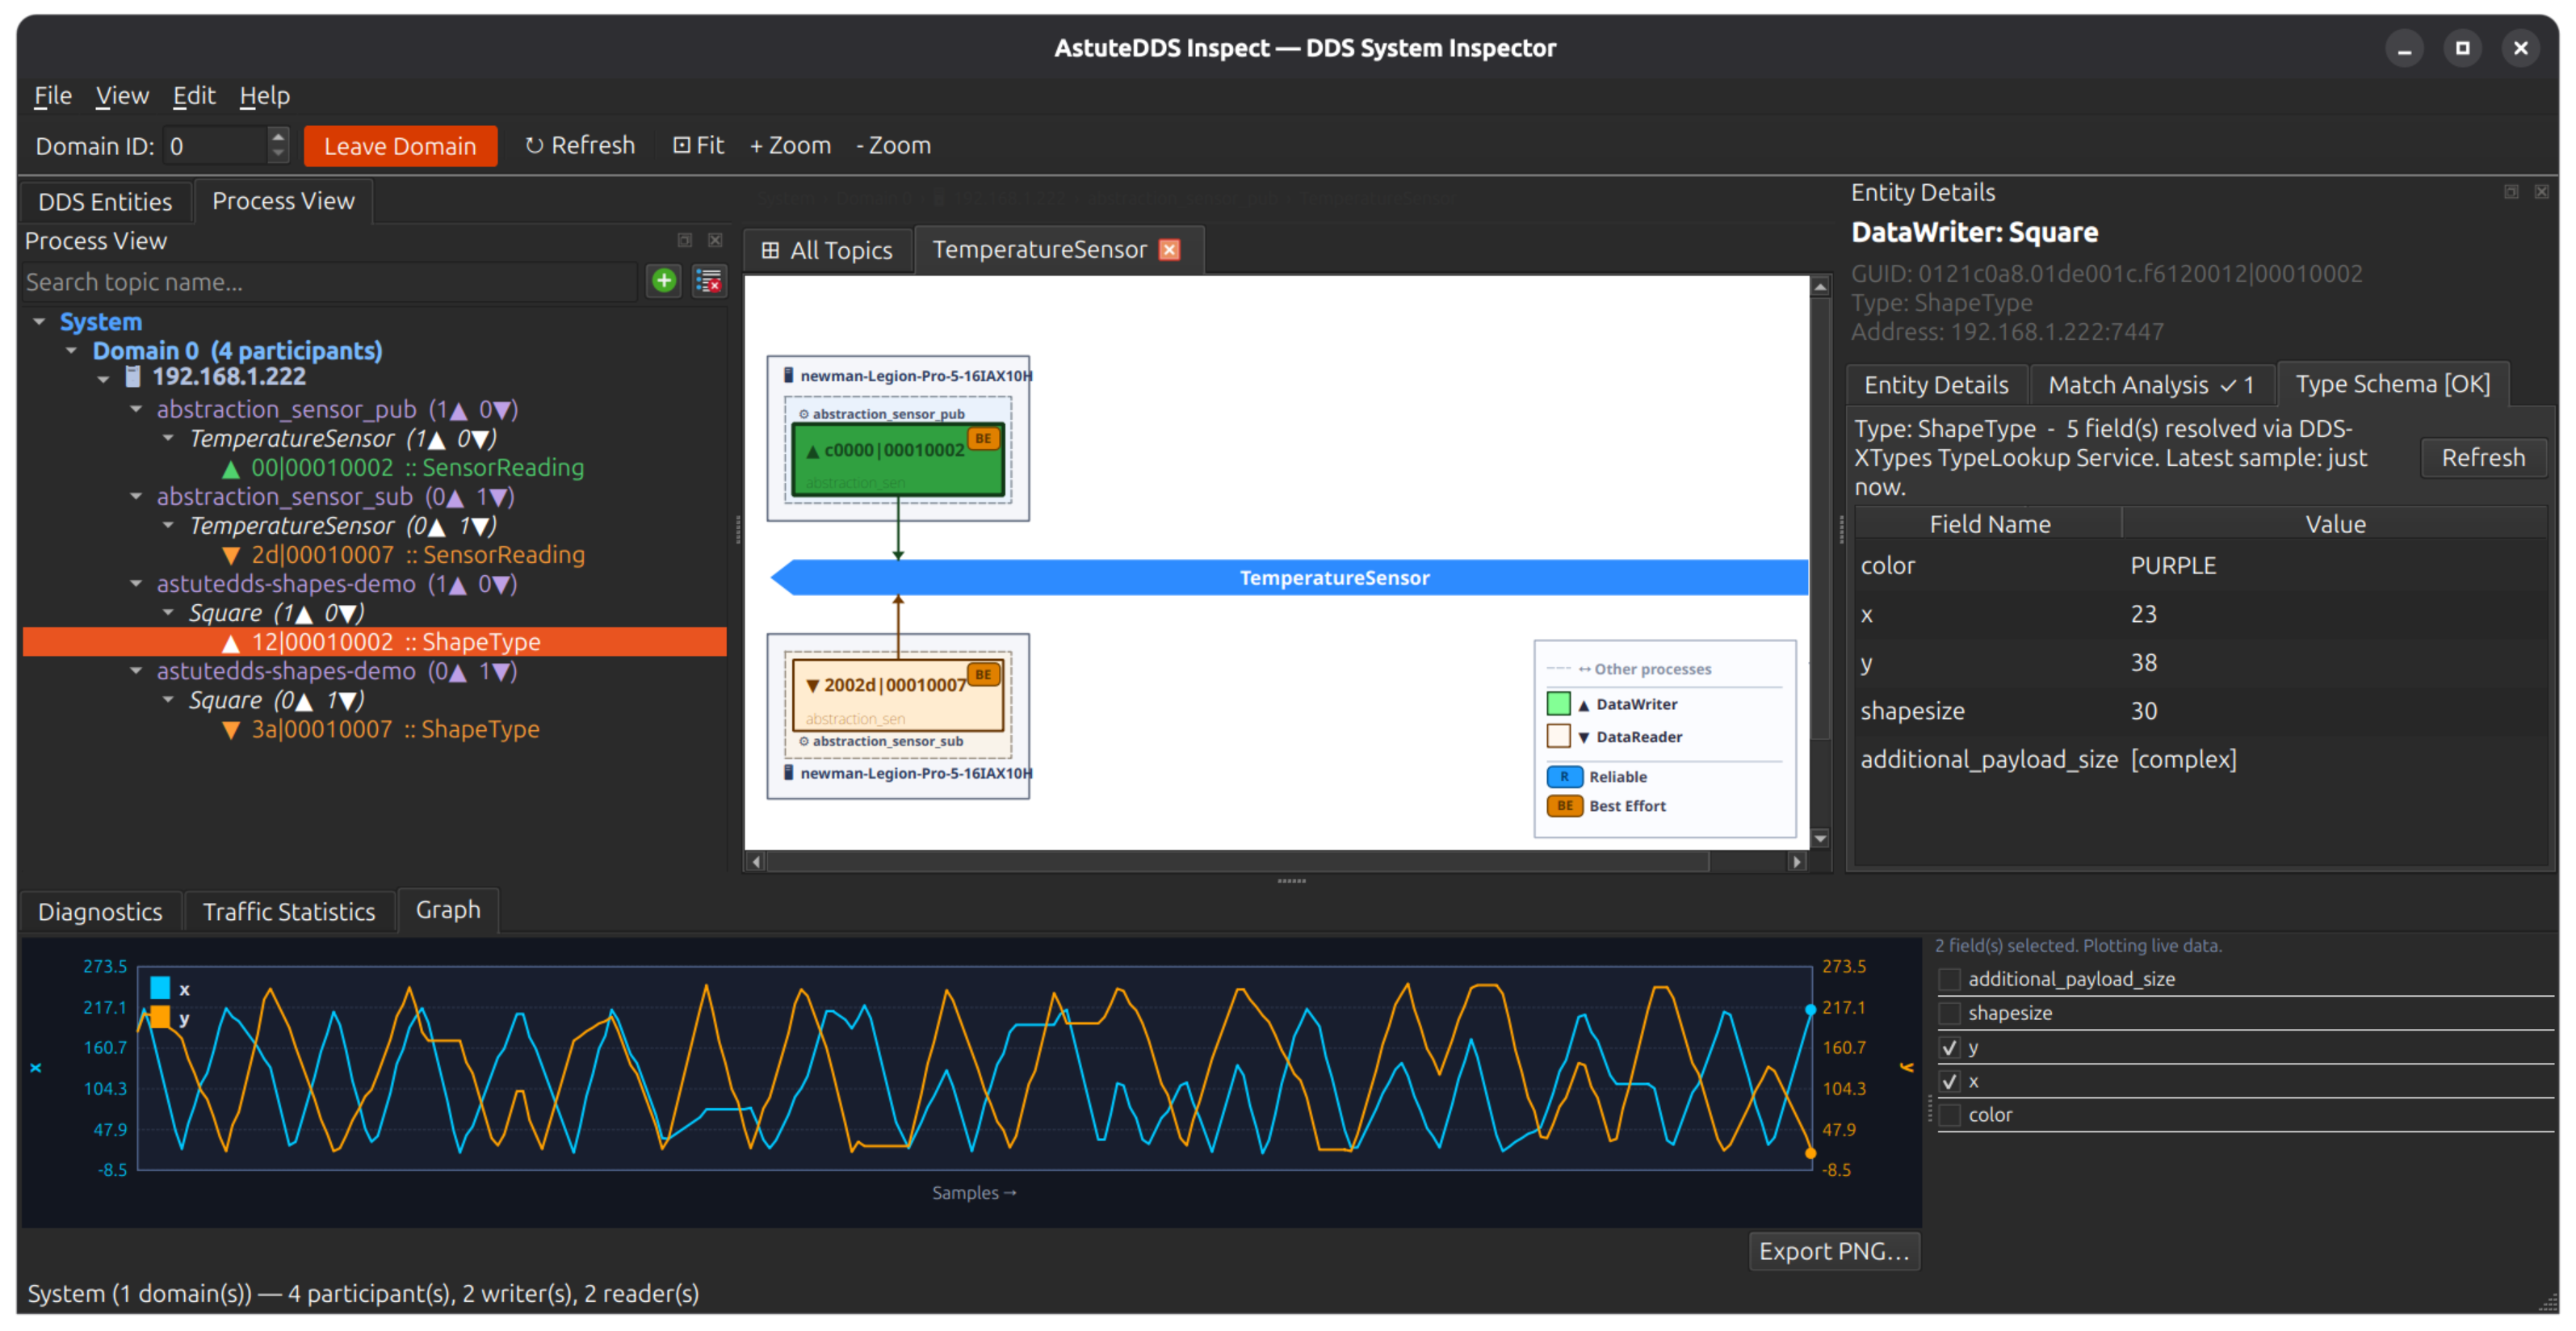
5. Type Schema and Live Values
When type information is available, Type Schema shows resolved fields and latest values. This helps verify semantic correctness, not just transport connectivity.
Value to developers
- Confirm field-level behavior during refactors
- Verify sensor/calculation output quickly
- Detect type mismatches earlier in integration cycles
6. Traffic Statistics Panel
The Traffic Statistics table gives per-topic throughput and packet rates, so performance regressions are visible without external tooling.
Value to developers
- Identify heavy topics quickly
- Compare behavior across test runs
- Track whether rate changes come from publisher load or subscription health
7. Diagnostics Panel
Diagnostics consolidates discovery and topology events in a single stream so operators can see when joins, leaves, and mismatch events occur.
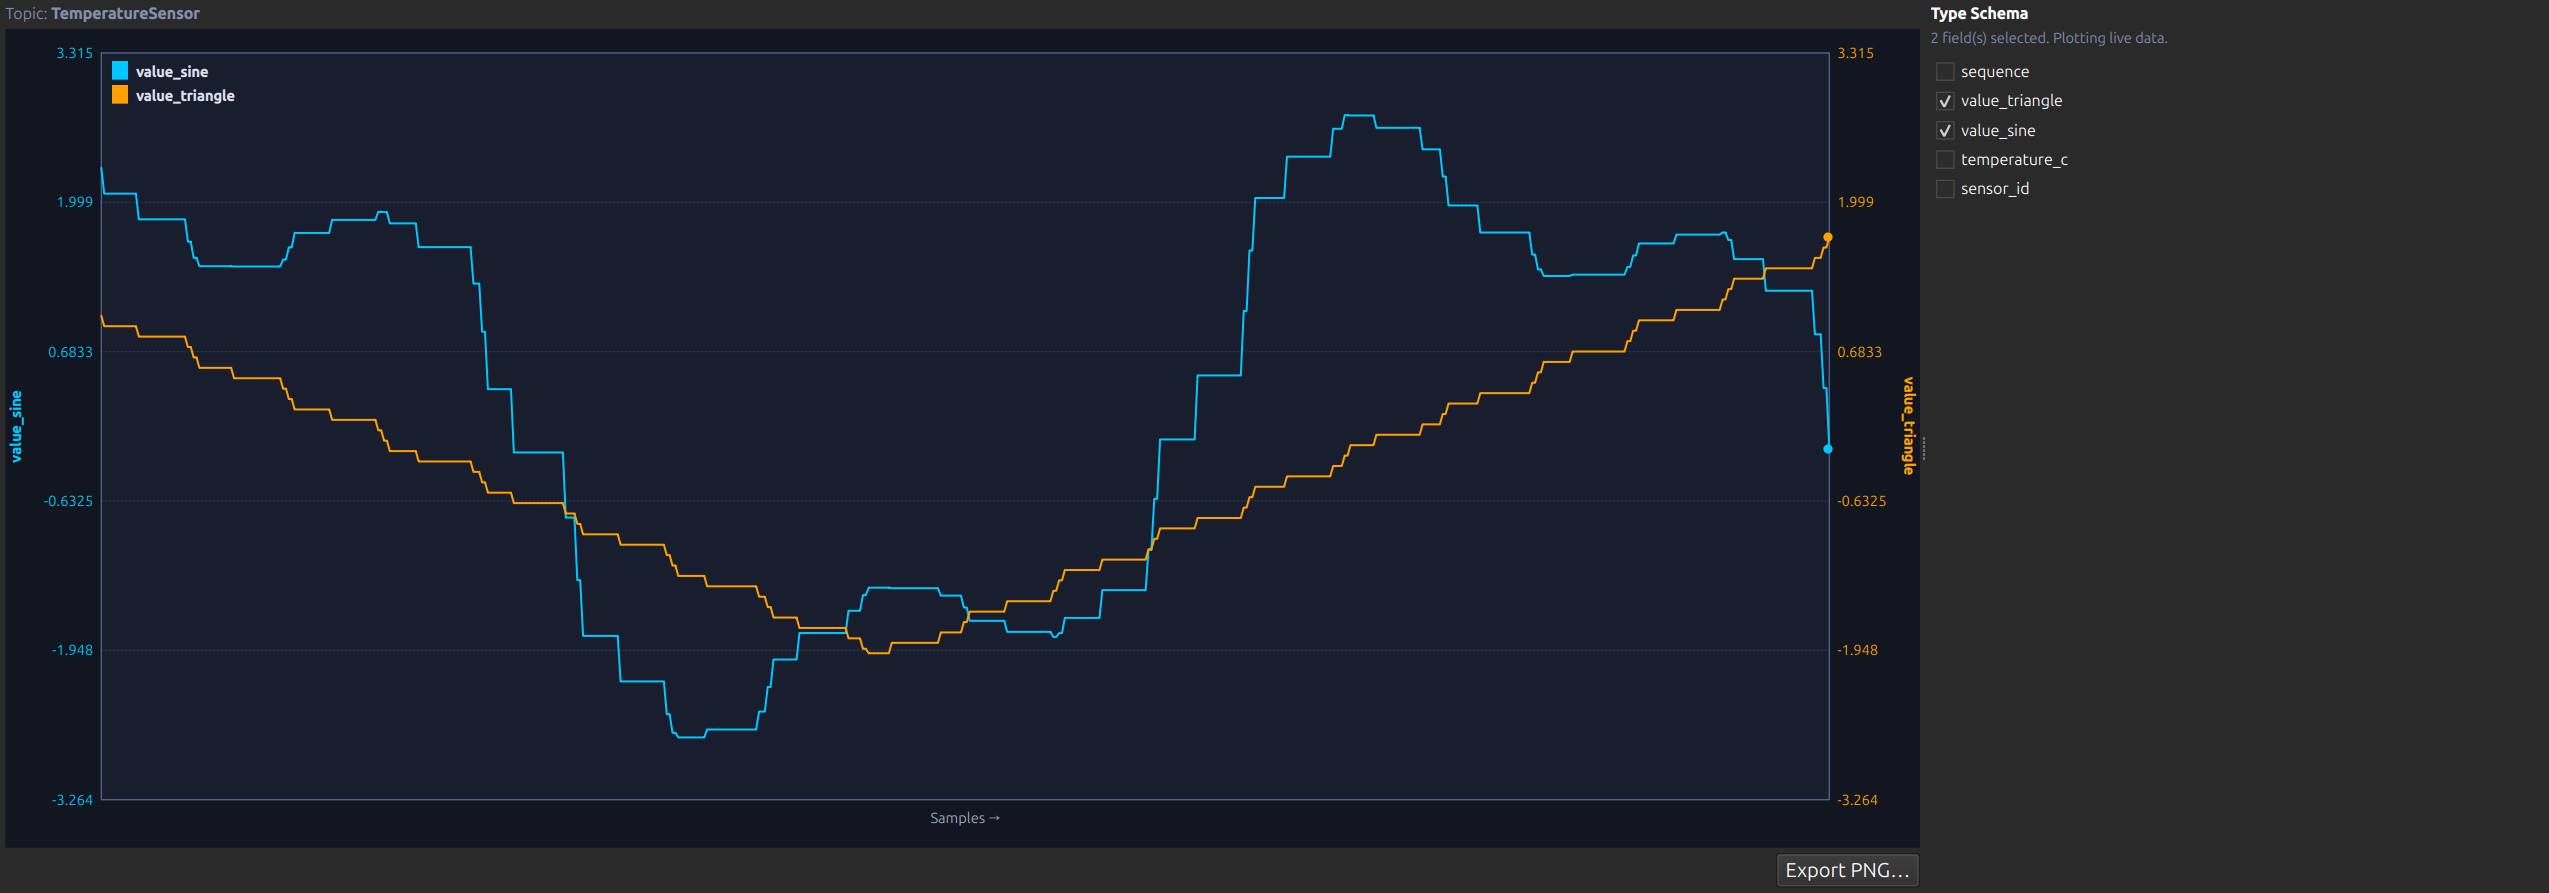
8. Graph Panel for Field Trends
The Graph tab plots selected fields over time. Combined with schema checkboxes, it becomes a quick behavior validation tool during development and test.
Continue to Live Analysis Workflows for step-by-step playbooks.